

Events
Availability
Events are currently available only to customers enrolled in the private preview. Contact your Customer Success Manager to request enrollment.
Events are system-level occurrences reported by GameFabric components, such as image promotions, location syncs, and security detections. Use the Events feature to monitor activity across your installation, investigate incidents, and correlate related occurrences across time.
GameFabric surfaces events in two places: the event panel (accessible from the bell icon on any page) for a quick view of recent activity, and the Events page for a full searchable log.
Permissions
To view events, a user must belong to a group with a role that has at least GET permission for the events resource in the event API group. See the Editing Permissions guide for more information.
Event categories
Every event belongs to one of three categories:
| Category | Description |
|---|---|
| Security | Security detections and threat-related events. |
| Informational | Operational events such as image promotions and configuration changes. |
| Other | Events that do not belong to a known category. Shown as Unknown on the Events page. |
Events panel
Click the bell icon in the header to open the events panel. Events are grouped by category; click a category header to expand or collapse it.
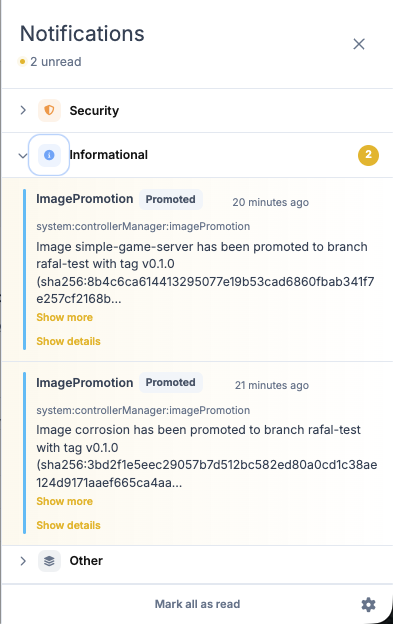
Each event shows its type, subtype, producer, timestamp, and message. Click Show more to read the full message, and Show details to view structured data attached by the producer.
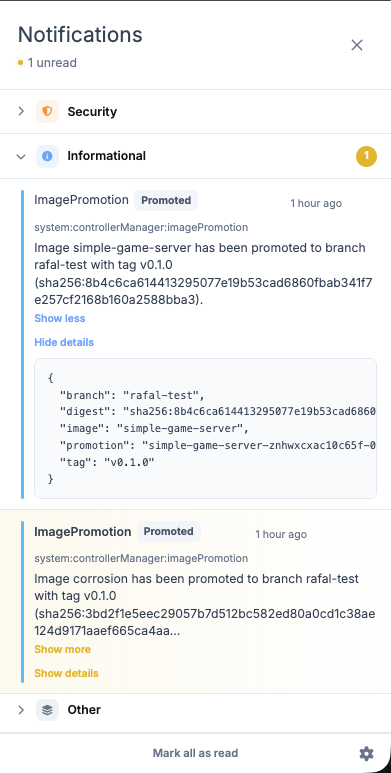
To mark an event as read, click it. To clear all unread markers at once, click Mark all as read in the panel footer. Unread state is stored in your browser and is not shared with other users.
To receive a brief pop-up alert when a new event arrives, open the settings in the panel footer and enable Show in-app toasts. This is off by default.
Events page
The Events page provides a complete, searchable log of all events visible to your account, sorted newest first. Open it by clicking Events in the sidebar.
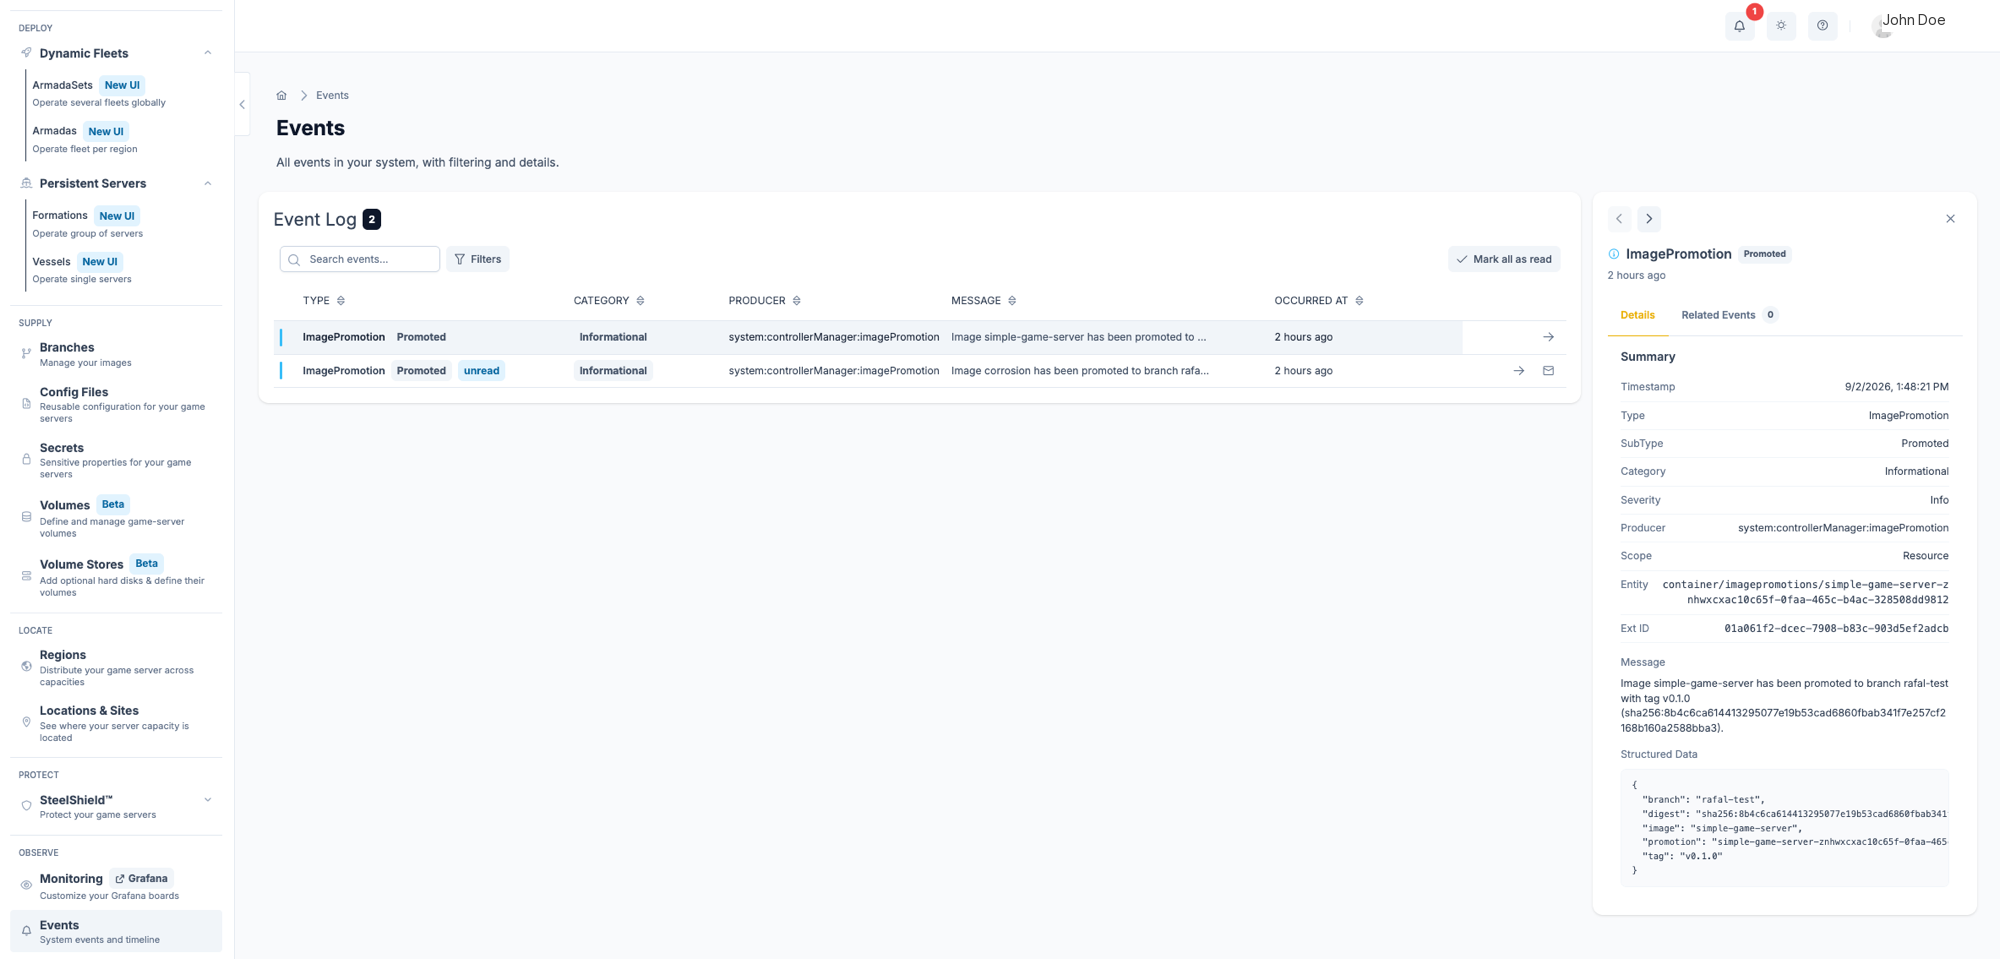
Use the search box to filter across Producer, Type, SubType, and Message simultaneously. Use the filter dropdowns to narrow by Category, Severity, or Producer.
Click any row to open the detail panel on the right. The panel shows:
- Timestamp — exact time the event occurred
- Type and SubType — event classification from the producer
- Category and Severity — grouping and priority
- Producer — the component that reported the event
- Scope —
Global(visible to all users with event access) orResource(scoped to specific resources) - Entity — the resources this event is linked to, when scope is
Resource - Ext ID — external correlation ID used to group related events
- Message — the full event message
- Structured Data — key-value metadata attached by the producer
Use the navigation arrows at the top of the panel to step through events without closing it.
Related events
Click Related Events in the detail panel to see a chronological timeline of all events sharing the same external ID. This is the primary tool for tracing a sequence of related occurrences — for example, a security detection followed by mitigation start and end events.