Monitoring & Logs
Each GameFabric installation comes with its own dedicated monitoring solution. This setup includes a personal Grafana installation. This Grafana instance provides visibility into the systems performance and operations. The Grafana dashboard allows you to monitor all metrics generated by the platform and related services and provides access to all your game server logs from one central location.
Data availability
Logs and metrics may be delayed by up to 2 minutes due to collection and processing pipelines.
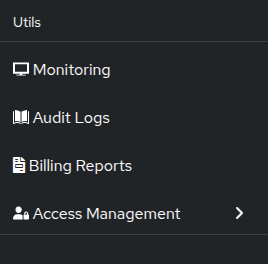
To access it, click on "Monitoring". 
Using Monitoring
The monitoring dashboards are especially useful for:
- Tracking CCU (Concurrent Users)
- Optimizing resource requests based on actual usage
- Viewing game server logs for debugging
Permissions
To access monitoring, a user must belong to a group with a role that has at least GET permission for the monitoring resource.
Users with POST permission can create custom dashboards and alerts.
Access Control
For more information on managing permissions, see Editing Permissions.
Metrics
There are metrics for every feature of the product. There are a lot of predefined dashboards under "Dashboards".
Logs
Everything that the game server prints to either stdout or stderr is automatically collected.
Logging Quotas
Logging is limited to 100 lines per second per game server with a 500 lines burst size and globally to 10 megabytes per second with a 50 megabyte burst size. If you require different limits, contact GameFabric support.